The art of data visualization has been used to benefit countless businesses across the years. In its most primitive form, it even predates industry. Presenting data in a particular way makes it more digestible.
As a data analyst, your job is to present data as well as possible. If you do so correctly, it could significantly aid your business intelligence. Data without proper presentation, refinement, and analysis is virtually worthless, so it’s important to know what you’re doing.
In this article, we’ll be covering data visualization and its role in business intelligence.
Why Data Visualization Matters in Business Intelligence?
Before we understand why we need a clear definition of what business intelligence is.
Business intelligence is a data analysis process that allows corporations to make informed business decisions based on data. Utilizing the process of data visualization will ensure that the whole process goes as smoothly as possible.
By accurately presenting your data, the process of streamlining your business intelligence will get a significant boost. Every person on the corporate ladder has a different job, and, based on their job description, their understanding of data will vary.
You can rest assured that all your data will be perceived correctly through proper data visualization. Not everyone is as skilled in reading spreadsheets and files upon files of data – but everyone can understand a simple pie chart.
Which Businesses Can Benefit from Data Visualization
Business intelligence, as a practice, is integral to most consumer-based businesses. Since most business models rely on actually serving a consumer need, business intelligence is necessary to all of them.
Proper business intelligence is synonymous with top of the line data visualization. Ensuring that all of your data is appropriately presented will do wonders for your business dealings.
As a data analyst, small business owner, or anyone else looking to get into the world of data visualizations, you’ll have to remember the golden rules.
- Collect all the data you can muster
- Do your best to refine it as much as possible
- After refinement, contemplate your data
- Finalize your data and present it in a visual medium
If you do this simple process, you can see that both you and your associates will change their perspective on your business dealing. Data visualization can aid CEOs, managers, and even bottom level employees in different ways. If you present it accurately, it will have an informative and positive impact on your business dealings – no matter how large or small.
What Kinds of Data Visualization Benefit Business?
Data visualization in business intelligence varies on the type of business. While some companies might be dealing with vast amounts of data, all of which have a varying level of importance – other companies might need to present a small amount.
For this purpose, there are many different ways to represent your data visually. Some of the most common ways to present data are:
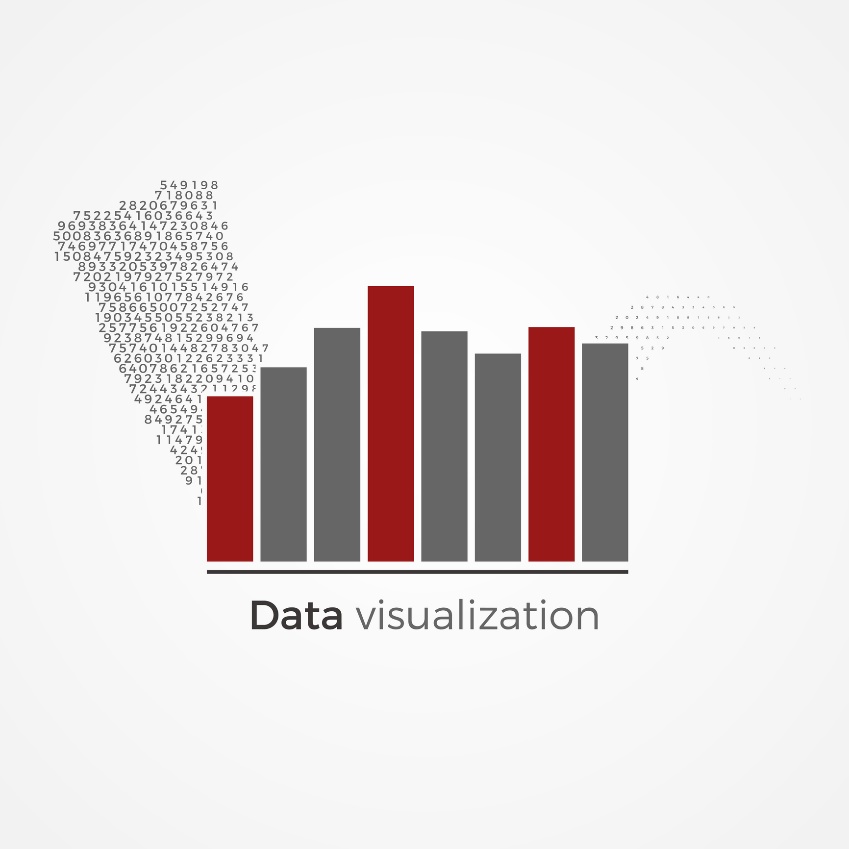
Charts, Bars, and Histograms
A chart is a great way to present your data, no matter how large or small. It’s best for businesses that have experienced staff, which will understand the charts. If you’re dealing with a smaller amount of data and a more inexperienced team, a pie chart might be your best bet.
Charts are useful because they have many different variables that can seamlessly be included within a graphical presentation. Aside from the many different types of charts out there, they can be integrated with all kinds of data.

Spreadsheets and Accompanying Visual Stimuli
While spreadsheets are the primary form of organizing and accumulating data for further refinement, they aren’t an excellent method to present data. What they are, on the other hand, is an ideal addition to data visualizations. Some spreadsheets allow you to highlight specific data that might have a more significant impact than others on your business dealings.
Presenting your data to your peers or employees through a spreadsheet is best left to professionals. Professional data analysts and people with prior knowledge of how data works will have far higher chances of deciphering and understanding a spreadsheet correctly.
If you’re looking to present a considerable amount of data in a moderately digestible way – spreadsheets combined with another visual medium are the way to go.
Graphs and Polls
Much like charts, graphs are an excellent way to present your data. On the other hand, they’re not nearly as ideal for displaying large amounts of data. Showing the business flow through graphs is a great way to make sure everyone understands it properly.
Graphs are simple – and that is by far their most exceptional feature. People tend to understand graphs without any accompanying information, as long as they’re made correctly.
If you’re looking to make a data visualization presentation, you might want to combine spreadsheets and graphs to make it both easy to digest, while having a sheet of further reading and analysis data for the more business intelligence savvy.
The Impacts of Data Visualizations in Business Intelligence
Using data visualization in your business intelligence practice, you can rest assured that:
- Your business will flow more smoothly
- Internal understanding of business operation will skyrocket
- Improved knowledge of previous events
- Better business coordination will be conducted due to data analysis
- Sophisticated data interaction and communication will occur
- Faster action, reaction, and adaptation become possible
Final Thoughts
There is no doubt that data visualization in business intelligence plays an integral role in the business flow. It will streamline the internal and external business processes, but it will ensure the data is understood and appropriately comprehended.
All employees, managers, CEOs, CFOs, and executives can benefit from data visualization in business intelligence in their way – so make sure to conduct it properly by remembering the information in this article!